Day 78: Creating a Billing Dashboard with Grafana Cloud and AWS CloudWatch (Feb 12, 2024)

Hey there! I'm currently working as an Associate DevOps Engineer, and I'm diving into popular DevOps tools like Azure Devops,Linux, Docker, Kubernetes,Terraform and Ansible. I'm also on the learning track with AWS certifications to amp up my cloud game. If you're into tech collaborations and exploring new horizons, let's connect!
Introduction
Grafana Cloud provides a robust platform for monitoring and visualization, while AWS CloudWatch offers a wealth of metrics for various AWS services. In this tutorial, we'll guide you through setting up a Grafana dashboard that visualizes AWS billing data using the Grafana Cloud and AWS CloudWatch.
Prerequisites
An AWS account with access to billing information.
An EC2 instance running a Linux operating system.
Docker installed on the EC2 instance.
A Grafana Cloud account (create one at grafana.com/get).
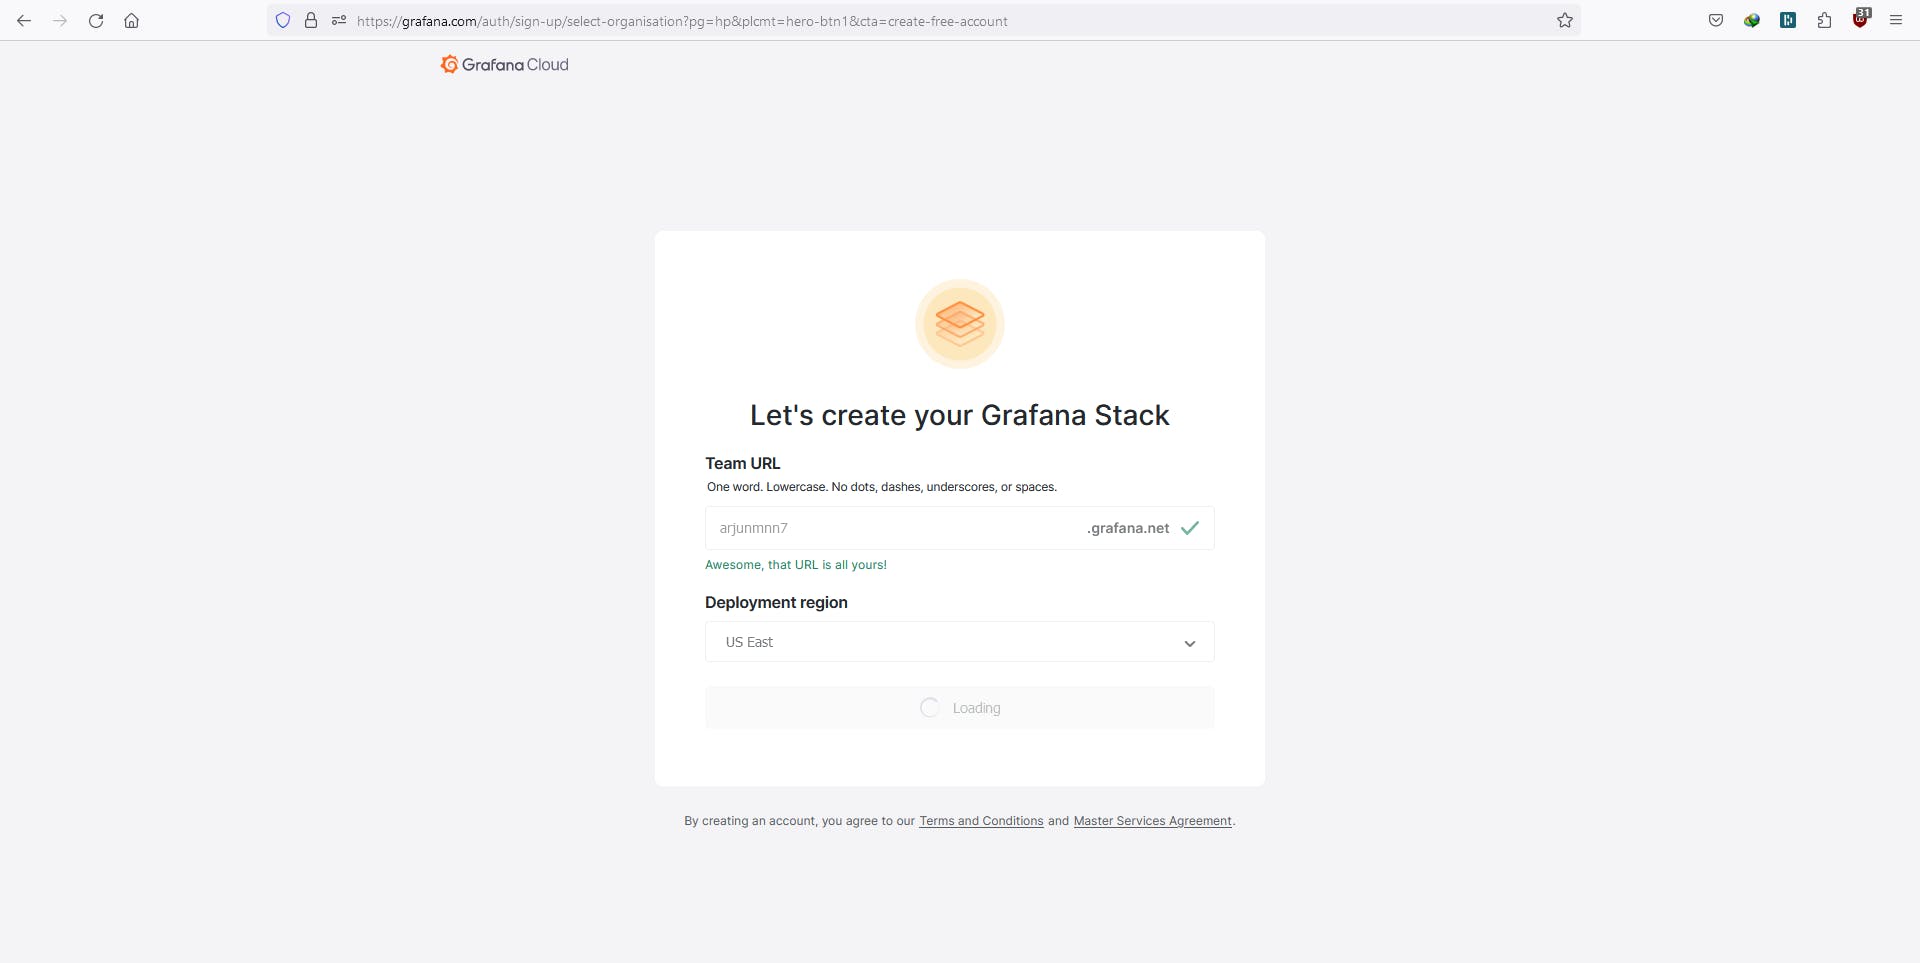
Step 1: Create Grafana Cloud Account
- Go to grafana.com/get and create a Grafana Cloud account.
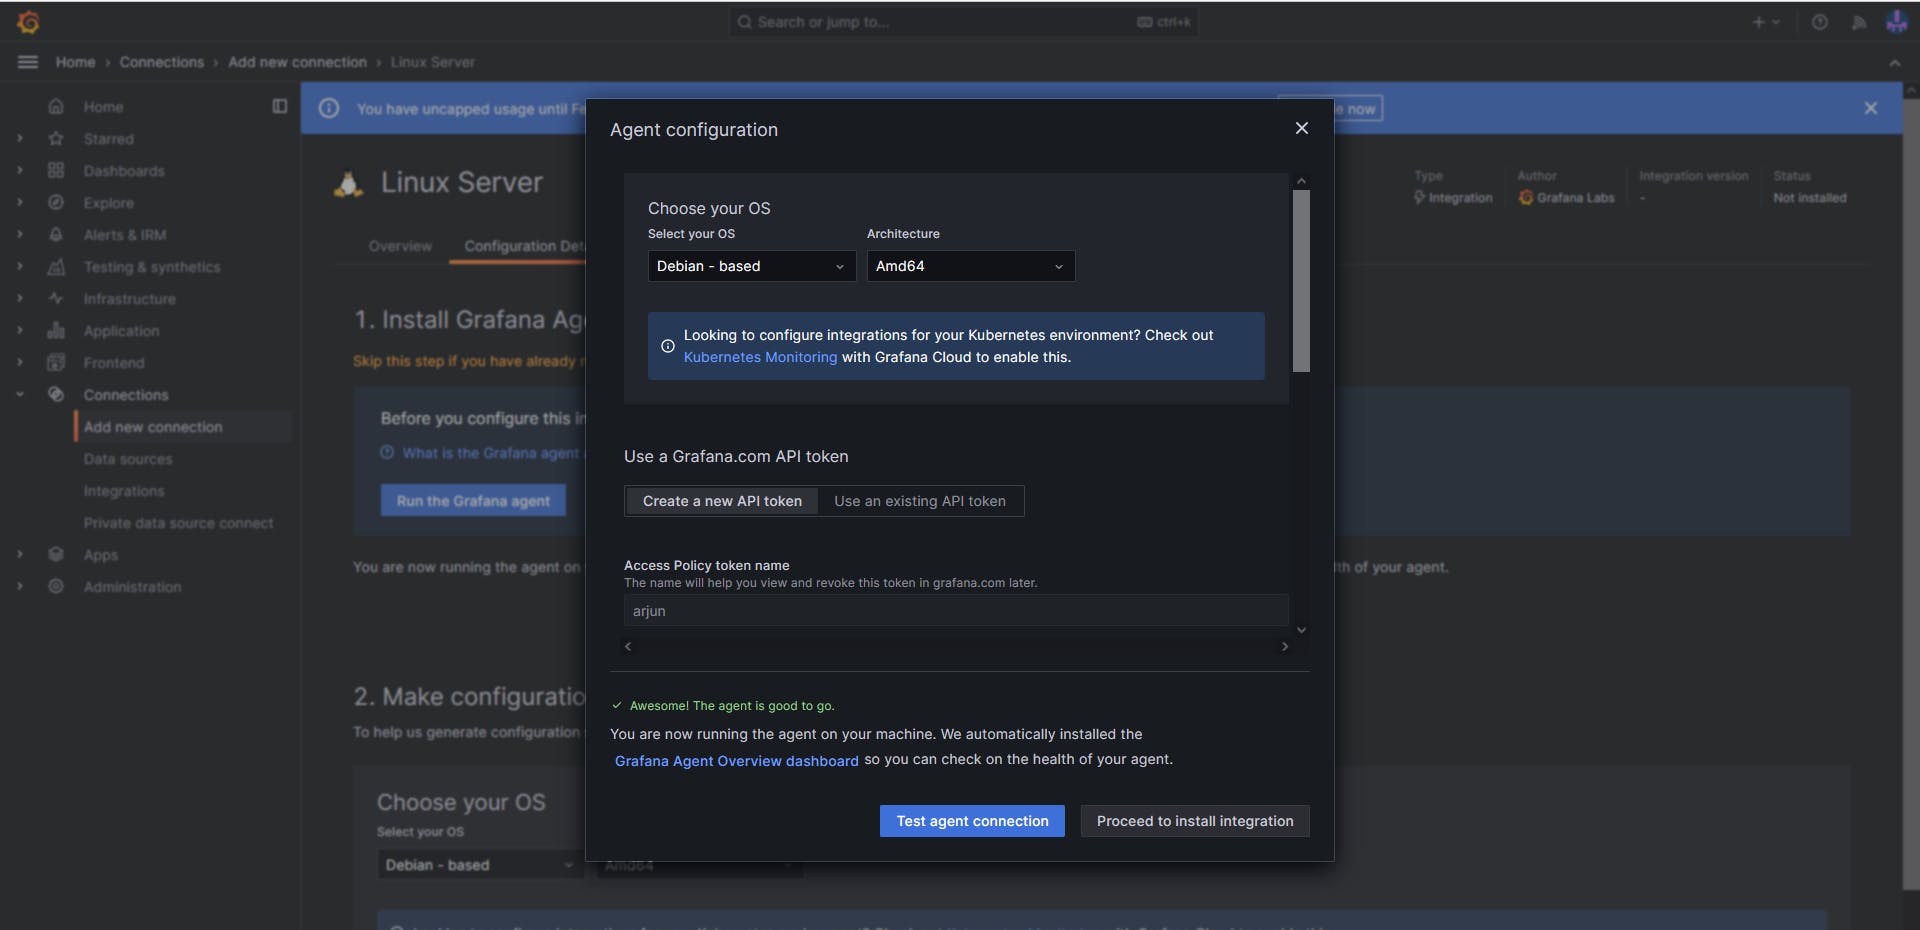
Step 2: Set Up Linux Server Dashboard
Click on "Create a Dashboard" and choose "Linux Server" dashboard.
Install the Grafana Agent on your EC2 instance. Generate an API token in Grafana Cloud and run the provided command on your EC2 instance.
Update the Grafana Agent config file on your EC2 instance (go to /etc) with the provided code.
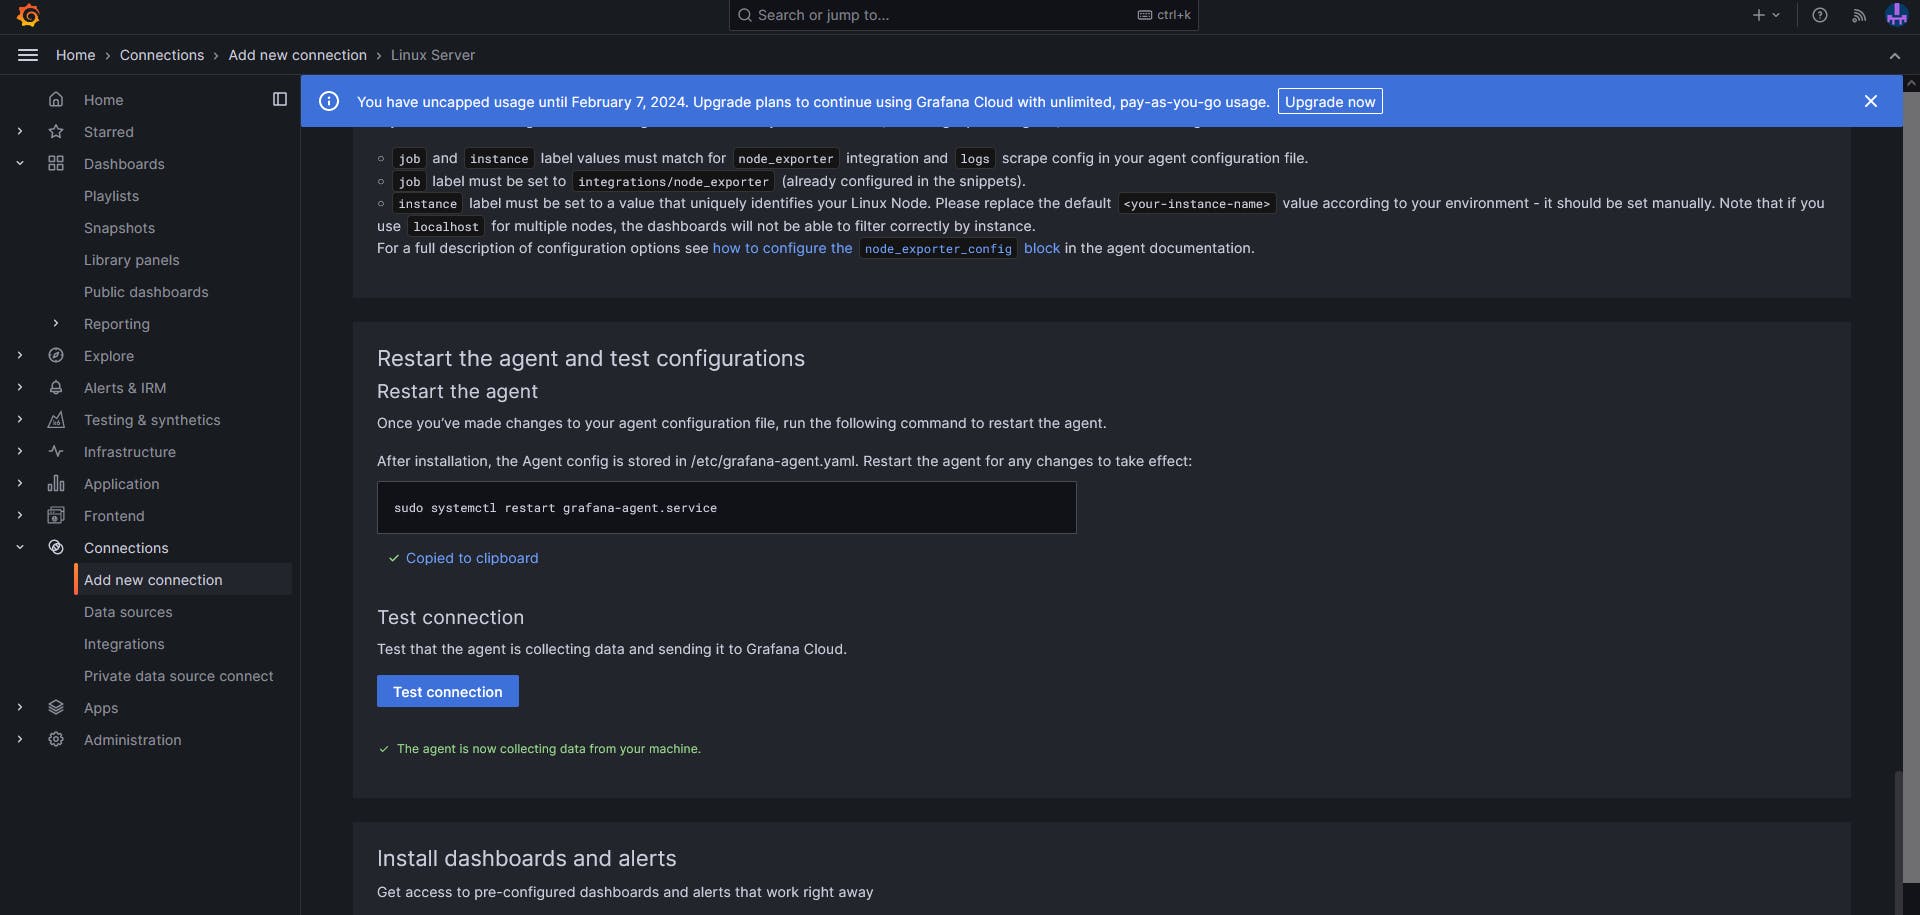
Restart the Grafana Agent.
sudo systemctl restart grafana-agent
- Test the connection.
Step 4: View Linux Node Metrics
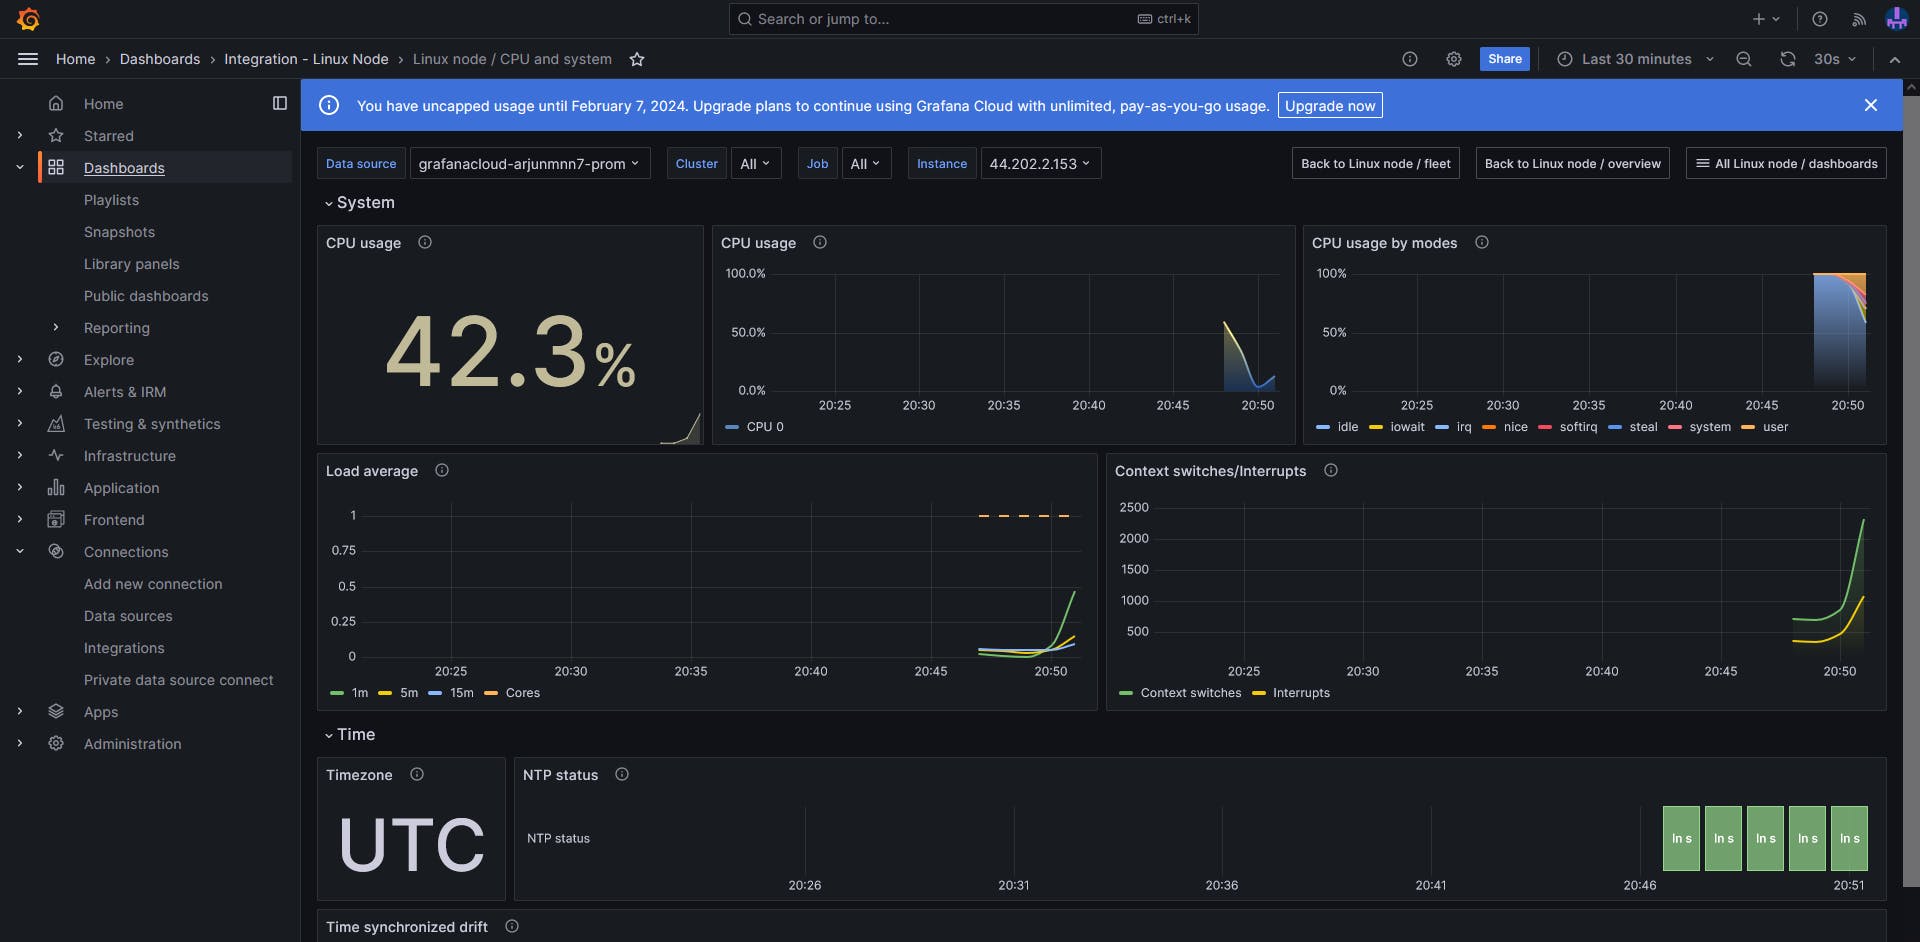
In the "Explore" section, select 'Linux Node/CPU and System.'
Observe CPU data. Run a Docker container on your EC2 instance to increase CPU usage and witness real-time updates.
Step 5: Connect AWS CloudWatch
In Grafana Cloud, go to "Settings" and choose "Data Sources."
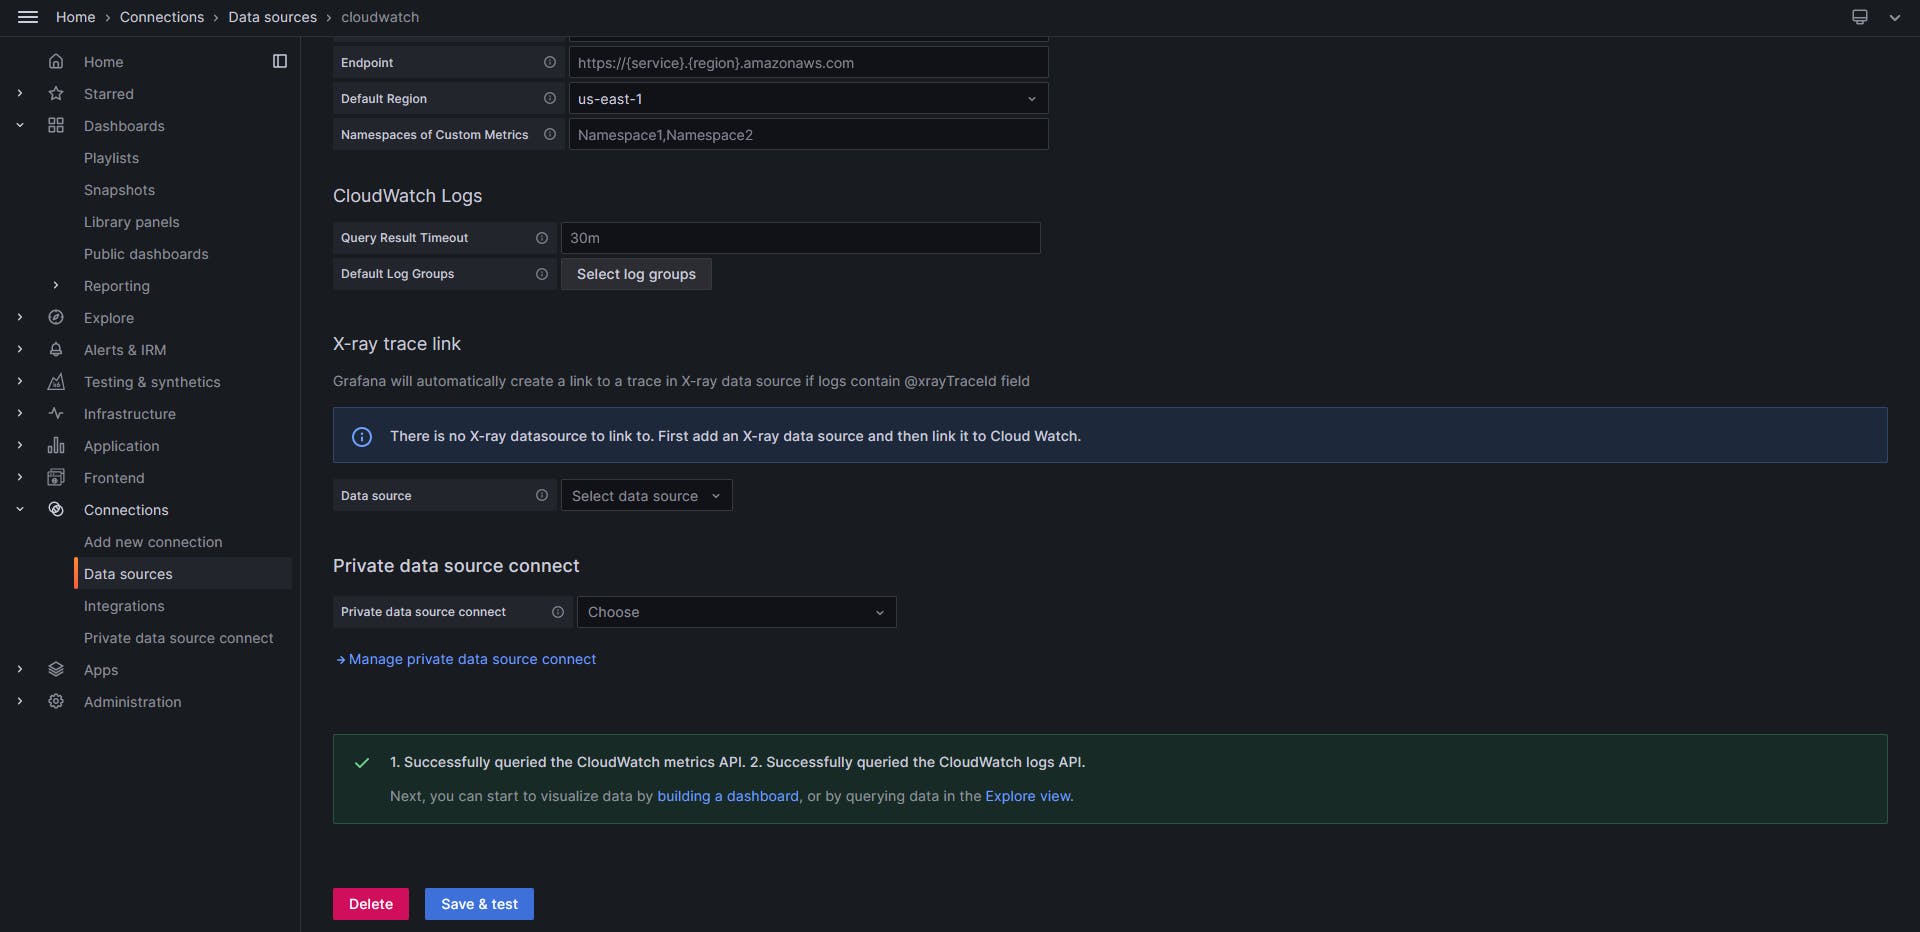
Click on "Add your first data source" and choose "CloudWatch."
Provide the AWS IAM user's username and password with programmatic access.
Select the region as 'us-east-1.'
Click on "Save & Test" to verify the connection.
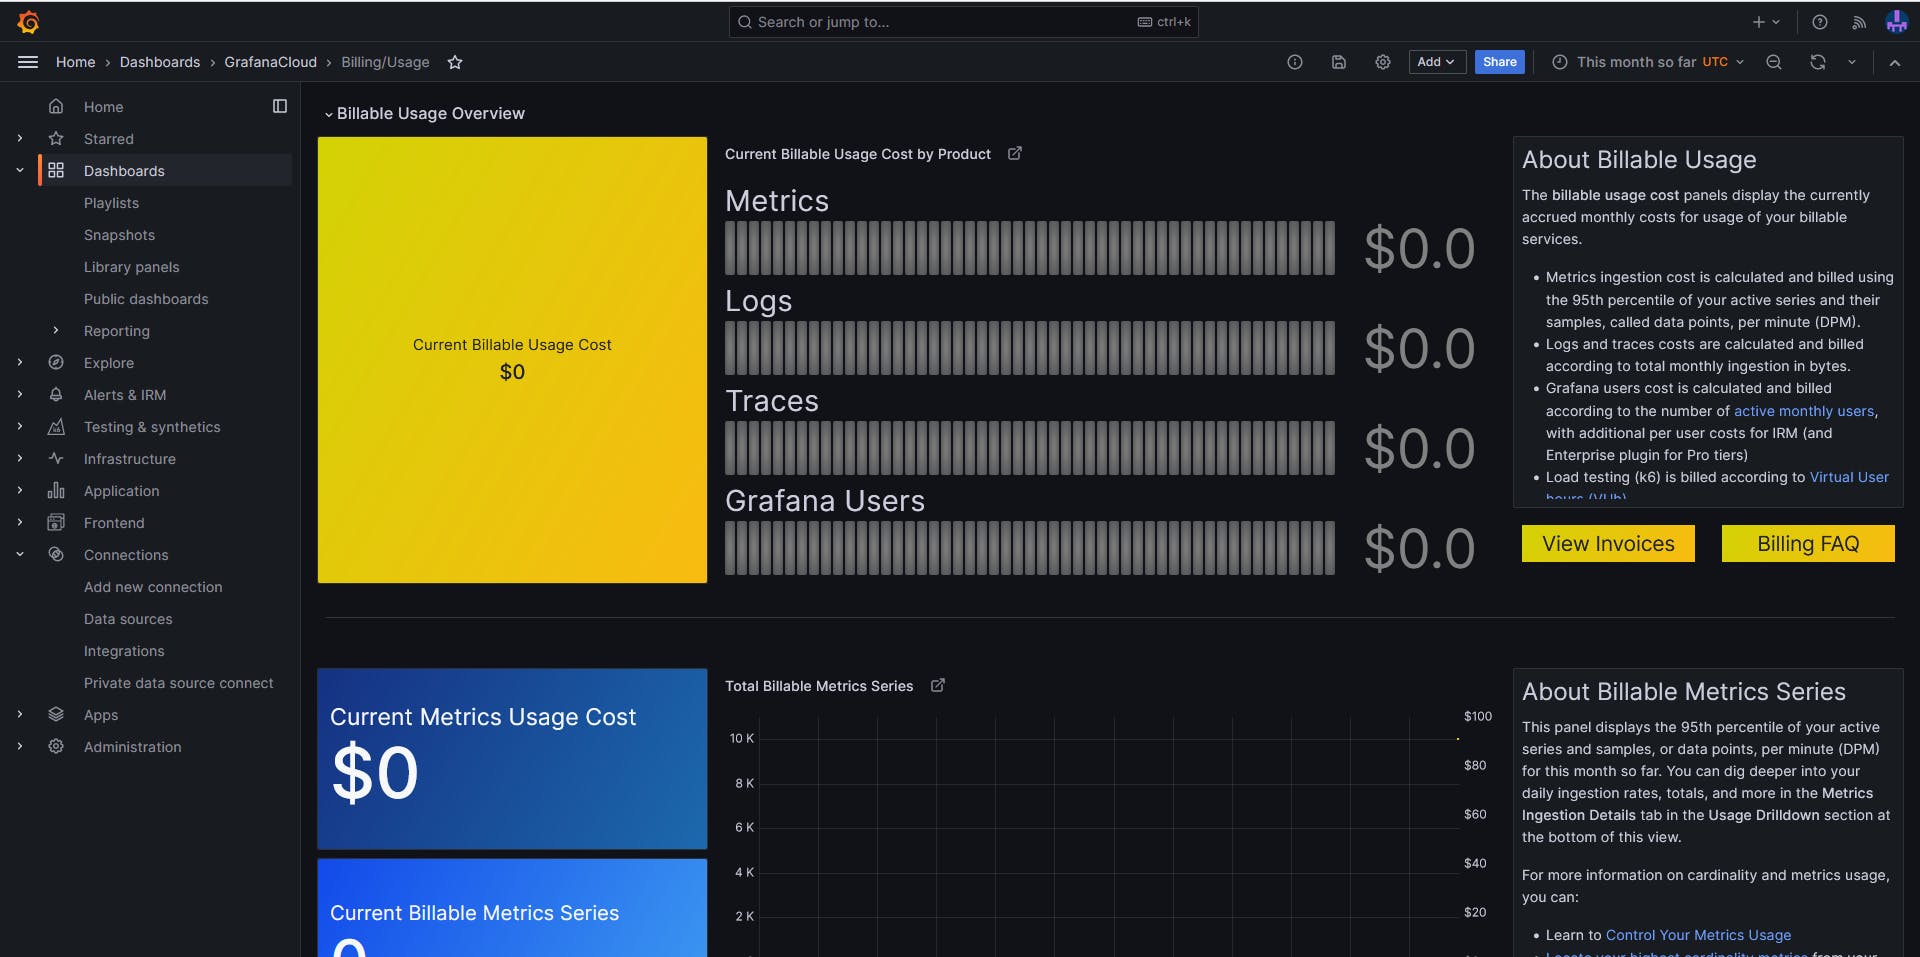
Step 6: Create Billing Dashboard
Navigate to the "Dashboards" section.
Look for a dashboard named 'Billing/Usage'.
Click on the dashboard to view the preconfigured panels displaying billing and usage metrics.